Mexico vs Philippines
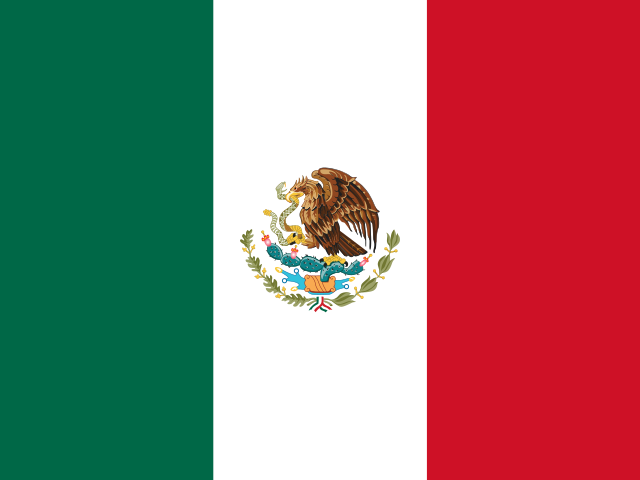

Verdict
Mexico holds a 64–36 advantage over Philippines on the Relative Advantage Index, a clear margin.
The margin is driven by military spending (68% of the combined total, $13.6bn) and economic size (GDP) (80% of the combined total, $1.9tn). Philippines leads on logistics & power projection.
1 factor — nuclear warheads — could not be scored because the figure is unpublished for at least one side. Those factors are excluded and the remaining weights renormalised, never substituted.
Factor by factor
| Factor | Mexico | Share | Philippines | Weight |
|---|---|---|---|---|
Military spending SIPRI Milex | $13.6bn | 68%32% | $6.4bn | 33% |
Economic size (GDP) World Bank WDI | $1.9tn | 80%20% | $462bn | 27% |
Active personnel COW NMC | 216.0k | 60%40% | 145.0k | 20% |
Logistics & power projection OurAirports | 89 | 41%59% | 127 | 20% |
Shares are each side's portion of the combined total for that factor. Weights are renormalised across the factors both sides publish — see the methodology. Data read 2026-08-04.

Major-power matchups (435)
Every combination inside the top 30 of the Composite Power Index.
Neighbour rivalries (473)
Bordering states — the comparisons people actually search for.